[vc_row full_width=”stretch_row” full_height=”yes” initial_loading_animation=”fadeIn” pofo_bg_image_type=”cover-background” desktop_height=”800px” pofo_enable_responsive_css=”1″ pofo_hidden_markup_1507704048_2_89=”” css=”.vc_custom_1704293542487{background-image: url(http://paulcollett.co.uk/wp-content/uploads/2024/01/Confidence-Hero.jpg?id=22971) !important;}” responsive_css=”height_tablet:700px|height_mobile:500px” class=”top-space”][vc_column width=”1/1″][/vc_column][/vc_row][vc_row full_width=”stretch_row_content” initial_loading_animation=”fadeIn”][vc_column width=”1/6″][/vc_column][vc_column width=”1/3″][pofo_section_heading pofo_heading_type=”heading-style2″ heading_preview_image=”heading-style2″ pofo_title_font_weight=”800″ pofo_title_element_tag=”h3″ pofo_hidden_markup_1507704398_2_97=”” pofo_hidden_markup_1504962443_2_46=”” pofo_hidden_markup_1504961628_2_78=”” pofo_heading=”Confidence Index” css=”.vc_custom_1704292673940{margin-bottom: 20px !important;}”][/vc_column][vc_column width=”1/3″][vc_column_text pofo_hidden_markup_1507704568_2_78=”” pofo_hidden_markup_1507704232_2_82=”” css=”.vc_custom_1704292697539{margin-bottom: 30px !important;}”]
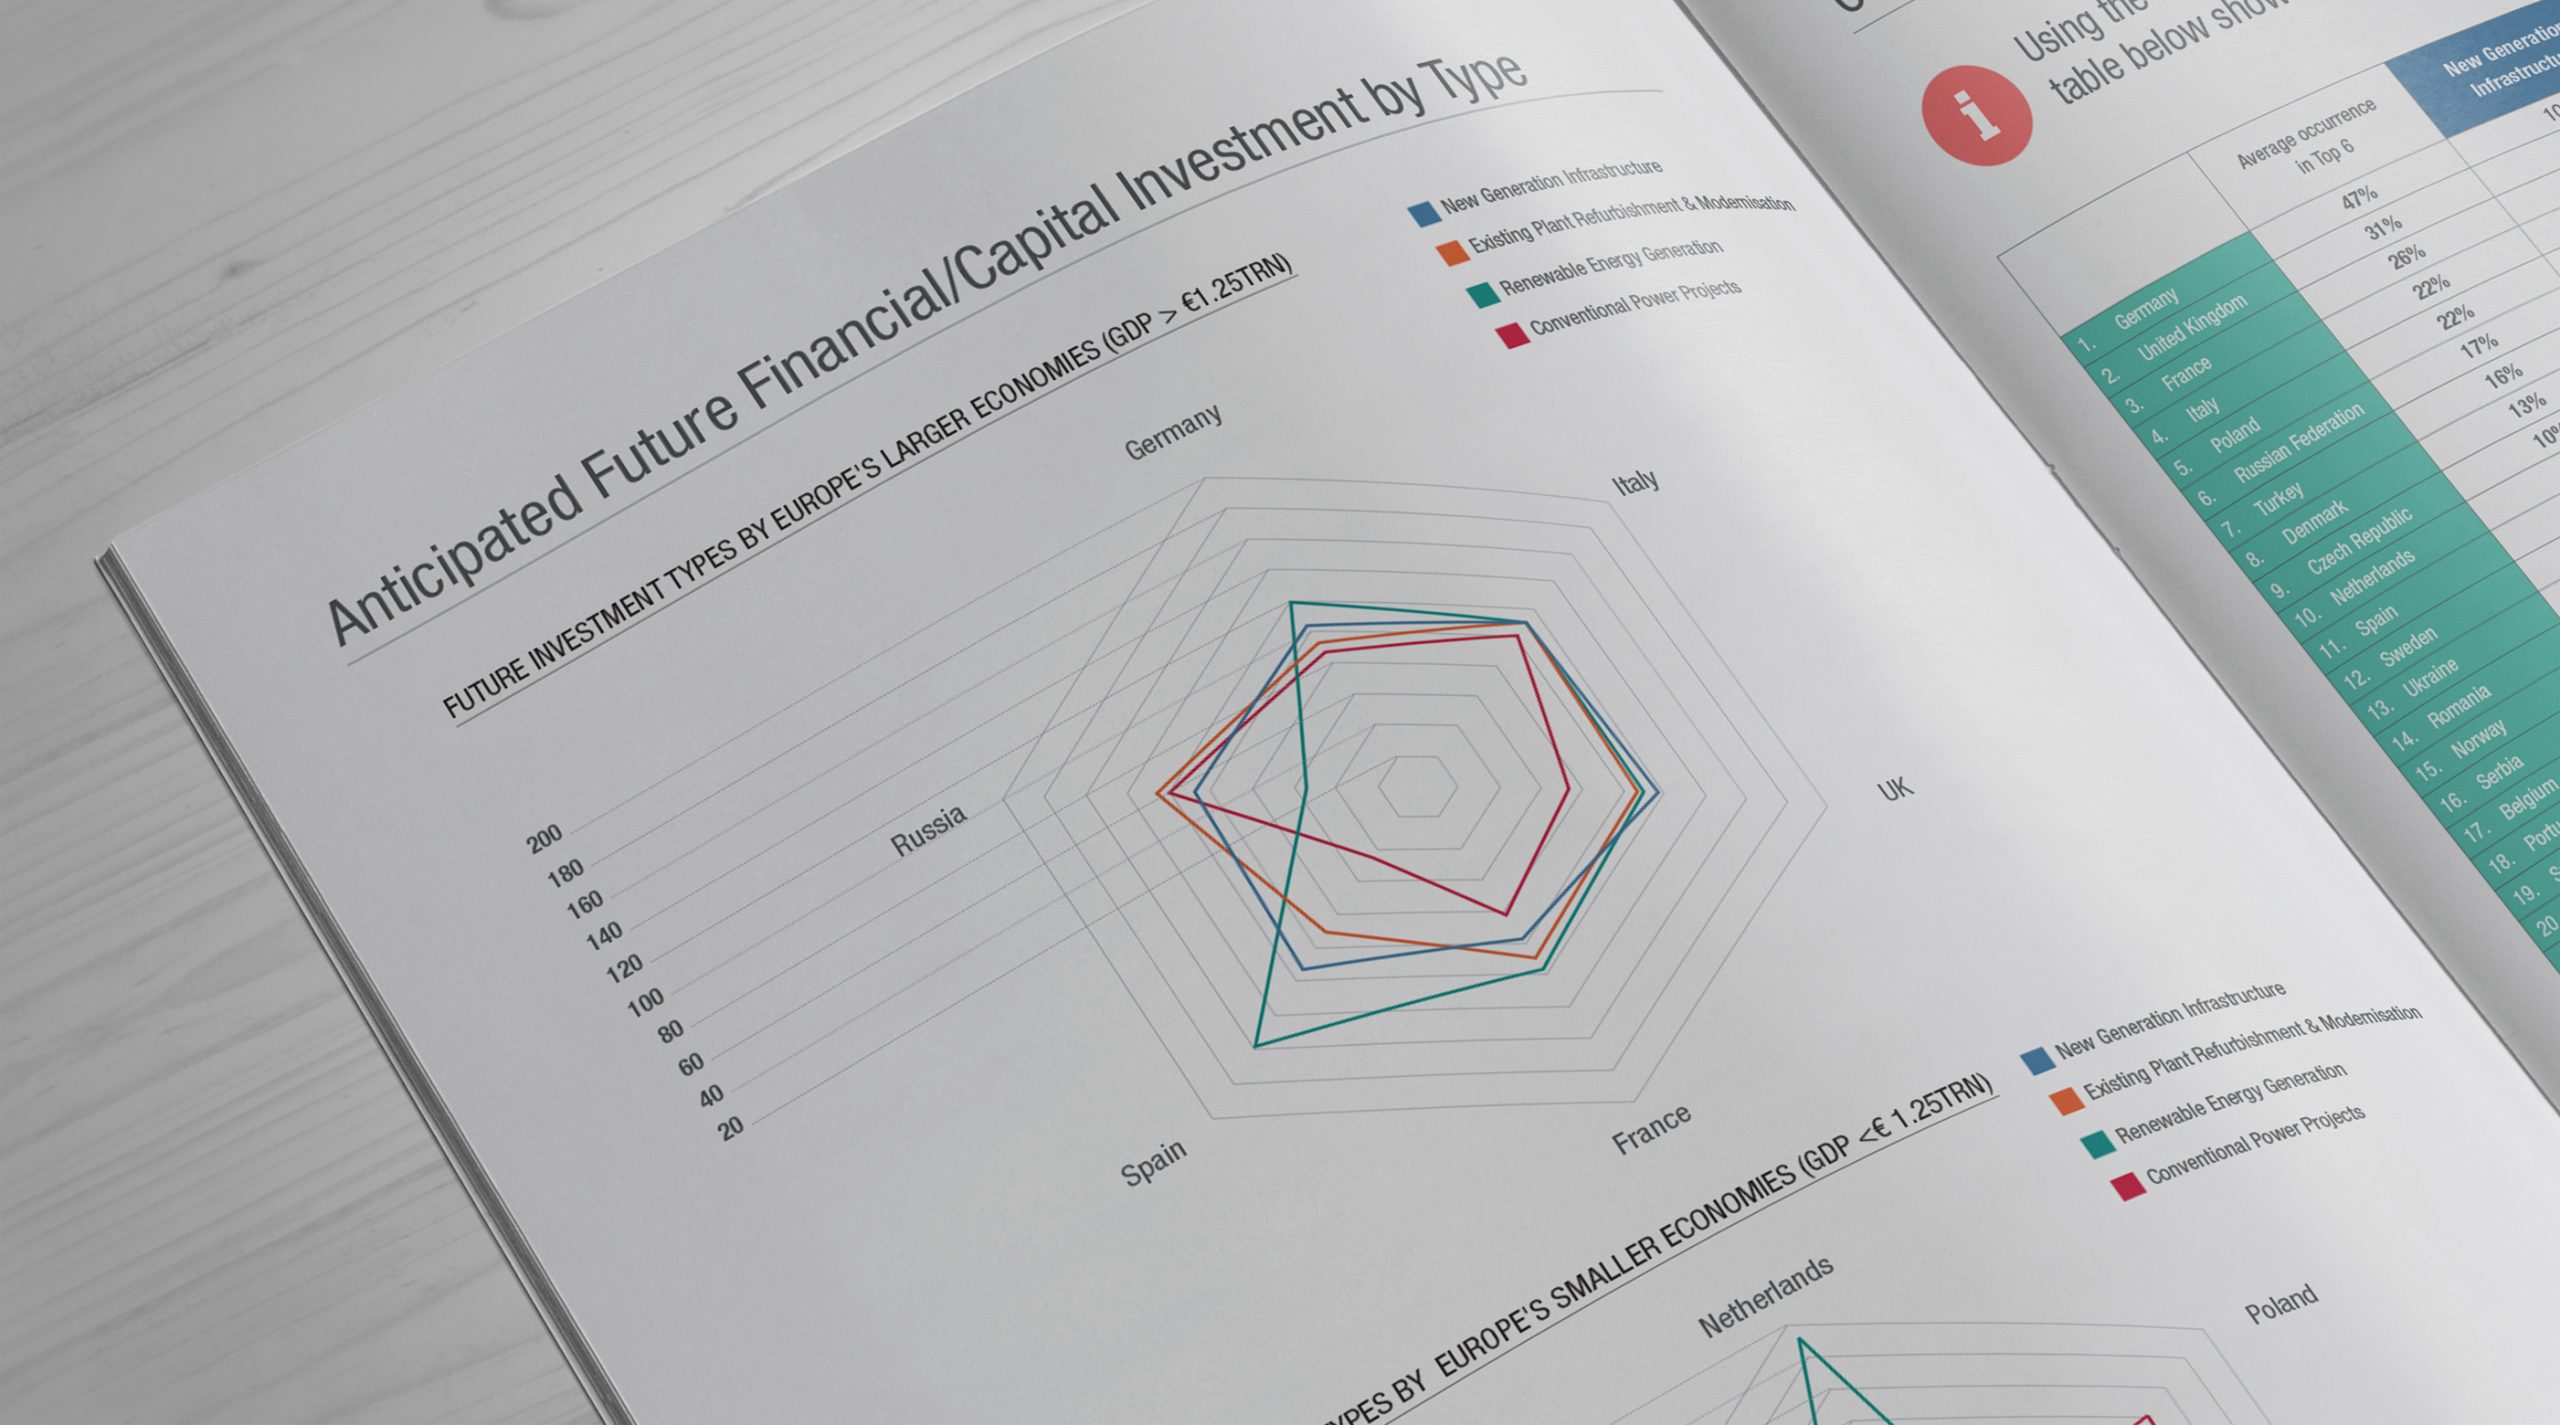
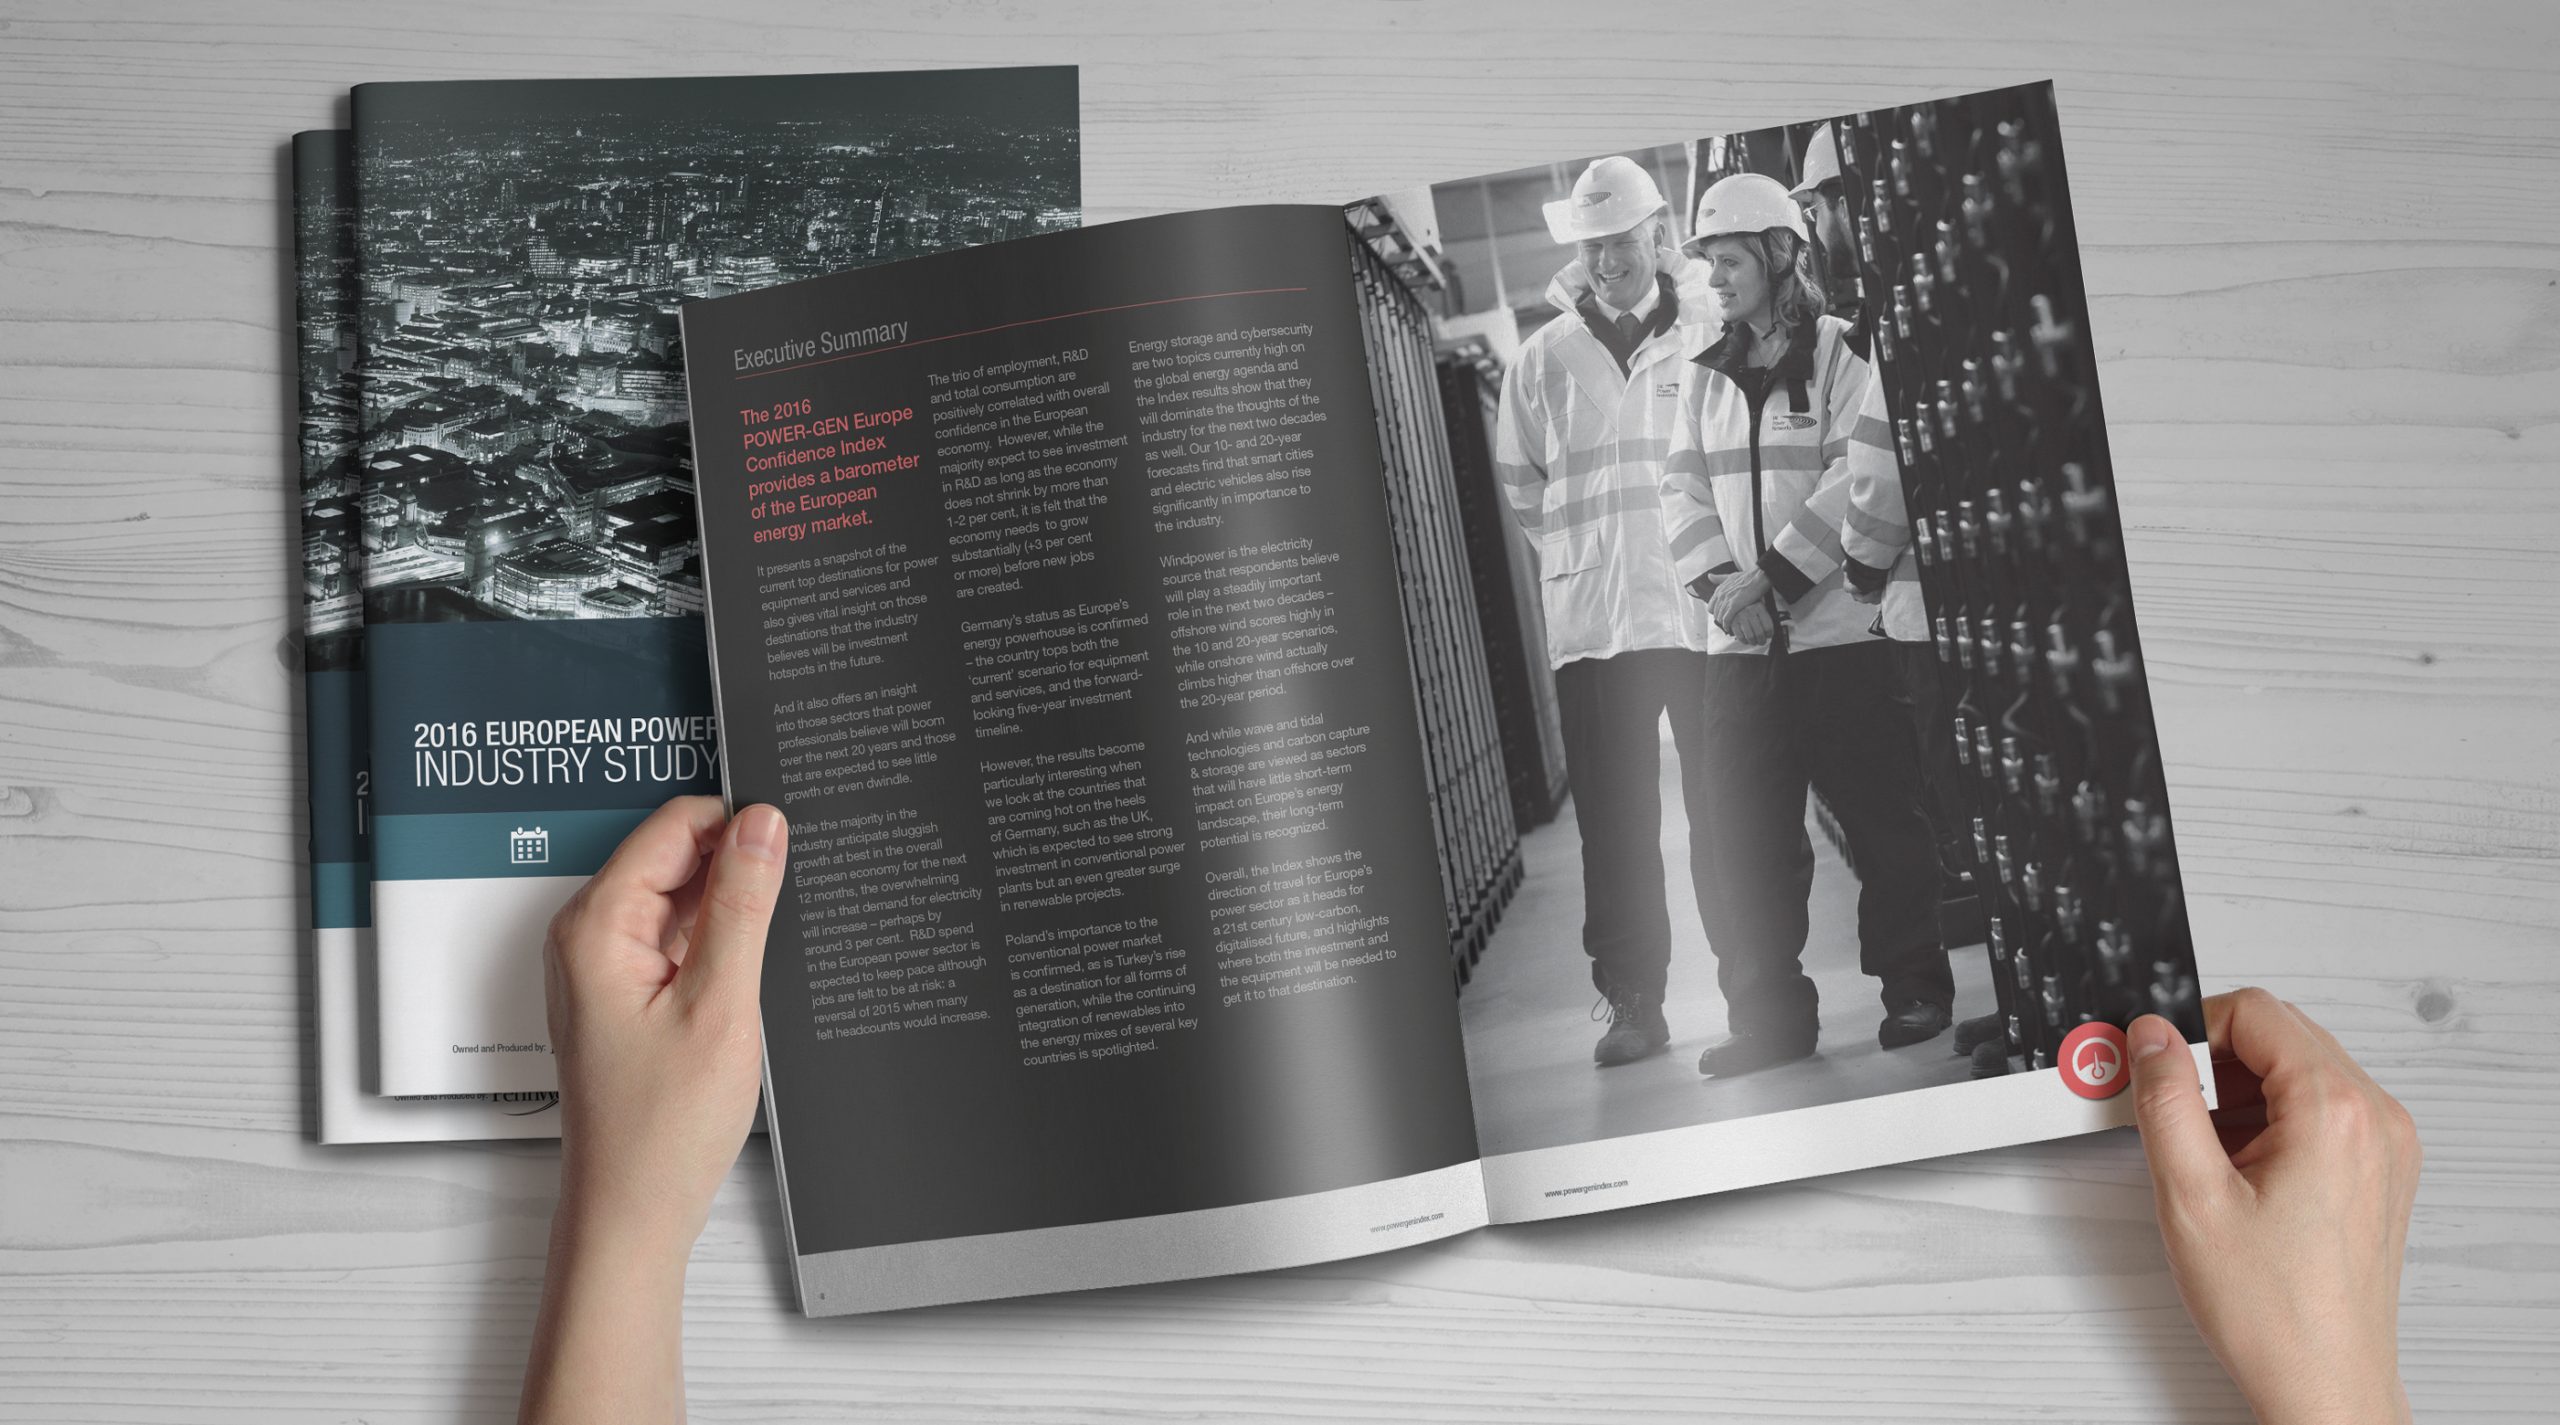
The Confidence Index project is a print brochure design that uses the power of data visualisation to transform complex Excel data into visually compelling and easily digestible infographics. This project seeks to bridge the gap between raw data and meaningful insights, as well as captivating audiences and communicating key information with clarity and impact.
[/vc_column_text][/vc_column][vc_column width=”1/6″][/vc_column][/vc_row][vc_row initial_loading_animation=”fadeIn” pofo_hidden_markup_1507705031_2_44=”” css=”.vc_custom_1507705055609{padding-top: 0px !important;padding-bottom: 0px !important;}”][vc_column width=”1/1″ pofo_hidden_markup_1507709561_2_20=”” css=”.vc_custom_1507709739552{padding-right: 0px !important;padding-left: 0px !important;}”][vc_single_image image=”3463″ img_size=”full” alignment=”center” el_class=”no-margin-bottom single-img-full” css=”.vc_custom_1704292736012{padding-top: 50px !important;padding-bottom: 50px !important;}”][/vc_column][/vc_row][vc_row initial_loading_animation=”fadeIn” pofo_hidden_markup_1507705031_2_44=”” css=”.vc_custom_1507705055609{padding-top: 0px !important;padding-bottom: 0px !important;}”][vc_column width=”1/1″ pofo_hidden_markup_1507709561_2_20=”” css=”.vc_custom_1507709739552{padding-right: 0px !important;padding-left: 0px !important;}”][vc_single_image image=”3462″ img_size=”full” alignment=”center” el_class=”no-margin-bottom single-img-full” css=”.vc_custom_1704292758028{padding-bottom: 50px !important;}”][/vc_column][/vc_row][vc_row full_width=”container” initial_loading_animation=”fadeIn”][vc_column width=”1/6″][/vc_column][vc_column width=”1/6″][/vc_column][vc_column width=”1/6″][/vc_column][vc_column width=”1/2″][pofo_section_heading pofo_heading_type=”heading-style4″ heading_preview_image=”heading-style4″ pofo_hidden_markup_1507704232_2_65=”” pofo_hidden_markup_1504962597_2_10=”” pofo_hidden_markup_1504962443_2_46=”” pofo_hidden_markup_1504960290_2_62=”” pofo_heading=”The Challenge” pofo_title_color=”#ff214f” pofo_title_font_size=”16px” pofo_title_line_height=”23px” css=”.vc_custom_1704036848516{margin-bottom: 10px !important;}”][pofo_section_heading pofo_heading_type=”heading-style2″ heading_preview_image=”heading-style2″ pofo_title_font_weight=”800″ pofo_title_element_tag=”h4″ pofo_hidden_markup_1507704398_2_97=”” pofo_hidden_markup_1504962443_2_46=”” pofo_hidden_markup_1504961628_2_78=”” pofo_heading=”Data symphony” css=”.vc_custom_1704292978731{margin-bottom: 20px !important;}”][vc_column_text pofo_hidden_markup_1507704568_2_78=”” pofo_hidden_markup_1507704232_2_82=”” css=”.vc_custom_1704293010048{margin-bottom: 30px !important;}”]
The abundance of data can be overwhelming and, at times, difficult to interpret. The primary hurdle was to convert this data into comprehensible and reader-friendly information. The task entailed presenting it in a manner that was not only easy to understand but also effectively emphasized the crucial information required.
[/vc_column_text][/vc_column][/vc_row][vc_row full_width=”stretch_row” parallax=”content-moving” initial_loading_animation=”fadeIn” desktop_height=”800px” pofo_enable_responsive_css=”1″ pofo_hidden_markup_1507641055_2_69=”” css=”.vc_custom_1704293051571{background-image: url(http://paulcollett.co.uk/wp-content/uploads/2023/08/Index_Paralax.jpg?id=3457) !important;}” responsive_css=”height_mobile:500px”][vc_column width=”1/1″][/vc_column][/vc_row][vc_row full_width=”container” initial_loading_animation=”fadeIn”][vc_column width=”1/6″][/vc_column][vc_column width=”1/6″][/vc_column][vc_column width=”1/6″][/vc_column][vc_column width=”1/2″][pofo_section_heading pofo_heading_type=”heading-style4″ heading_preview_image=”heading-style4″ pofo_hidden_markup_1507704232_2_65=”” pofo_hidden_markup_1504962597_2_10=”” pofo_hidden_markup_1504962443_2_46=”” pofo_hidden_markup_1504960290_2_62=”” pofo_heading=”The Idea” pofo_title_color=”#ff214f” pofo_title_font_size=”16px” pofo_title_line_height=”23px” css=”.vc_custom_1704037002685{margin-bottom: 10px !important;}”][pofo_section_heading pofo_heading_type=”heading-style2″ heading_preview_image=”heading-style2″ pofo_title_font_weight=”800″ pofo_title_element_tag=”h4″ pofo_hidden_markup_1507704398_2_97=”” pofo_hidden_markup_1504962443_2_46=”” pofo_hidden_markup_1504961628_2_78=”” pofo_heading=”Deconstructing data” css=”.vc_custom_1704293177047{margin-bottom: 20px !important;}”][vc_column_text pofo_hidden_markup_1507704568_2_78=”” pofo_hidden_markup_1507704232_2_82=”” css=”.vc_custom_1704293242149{margin-bottom: 30px !important;}”]
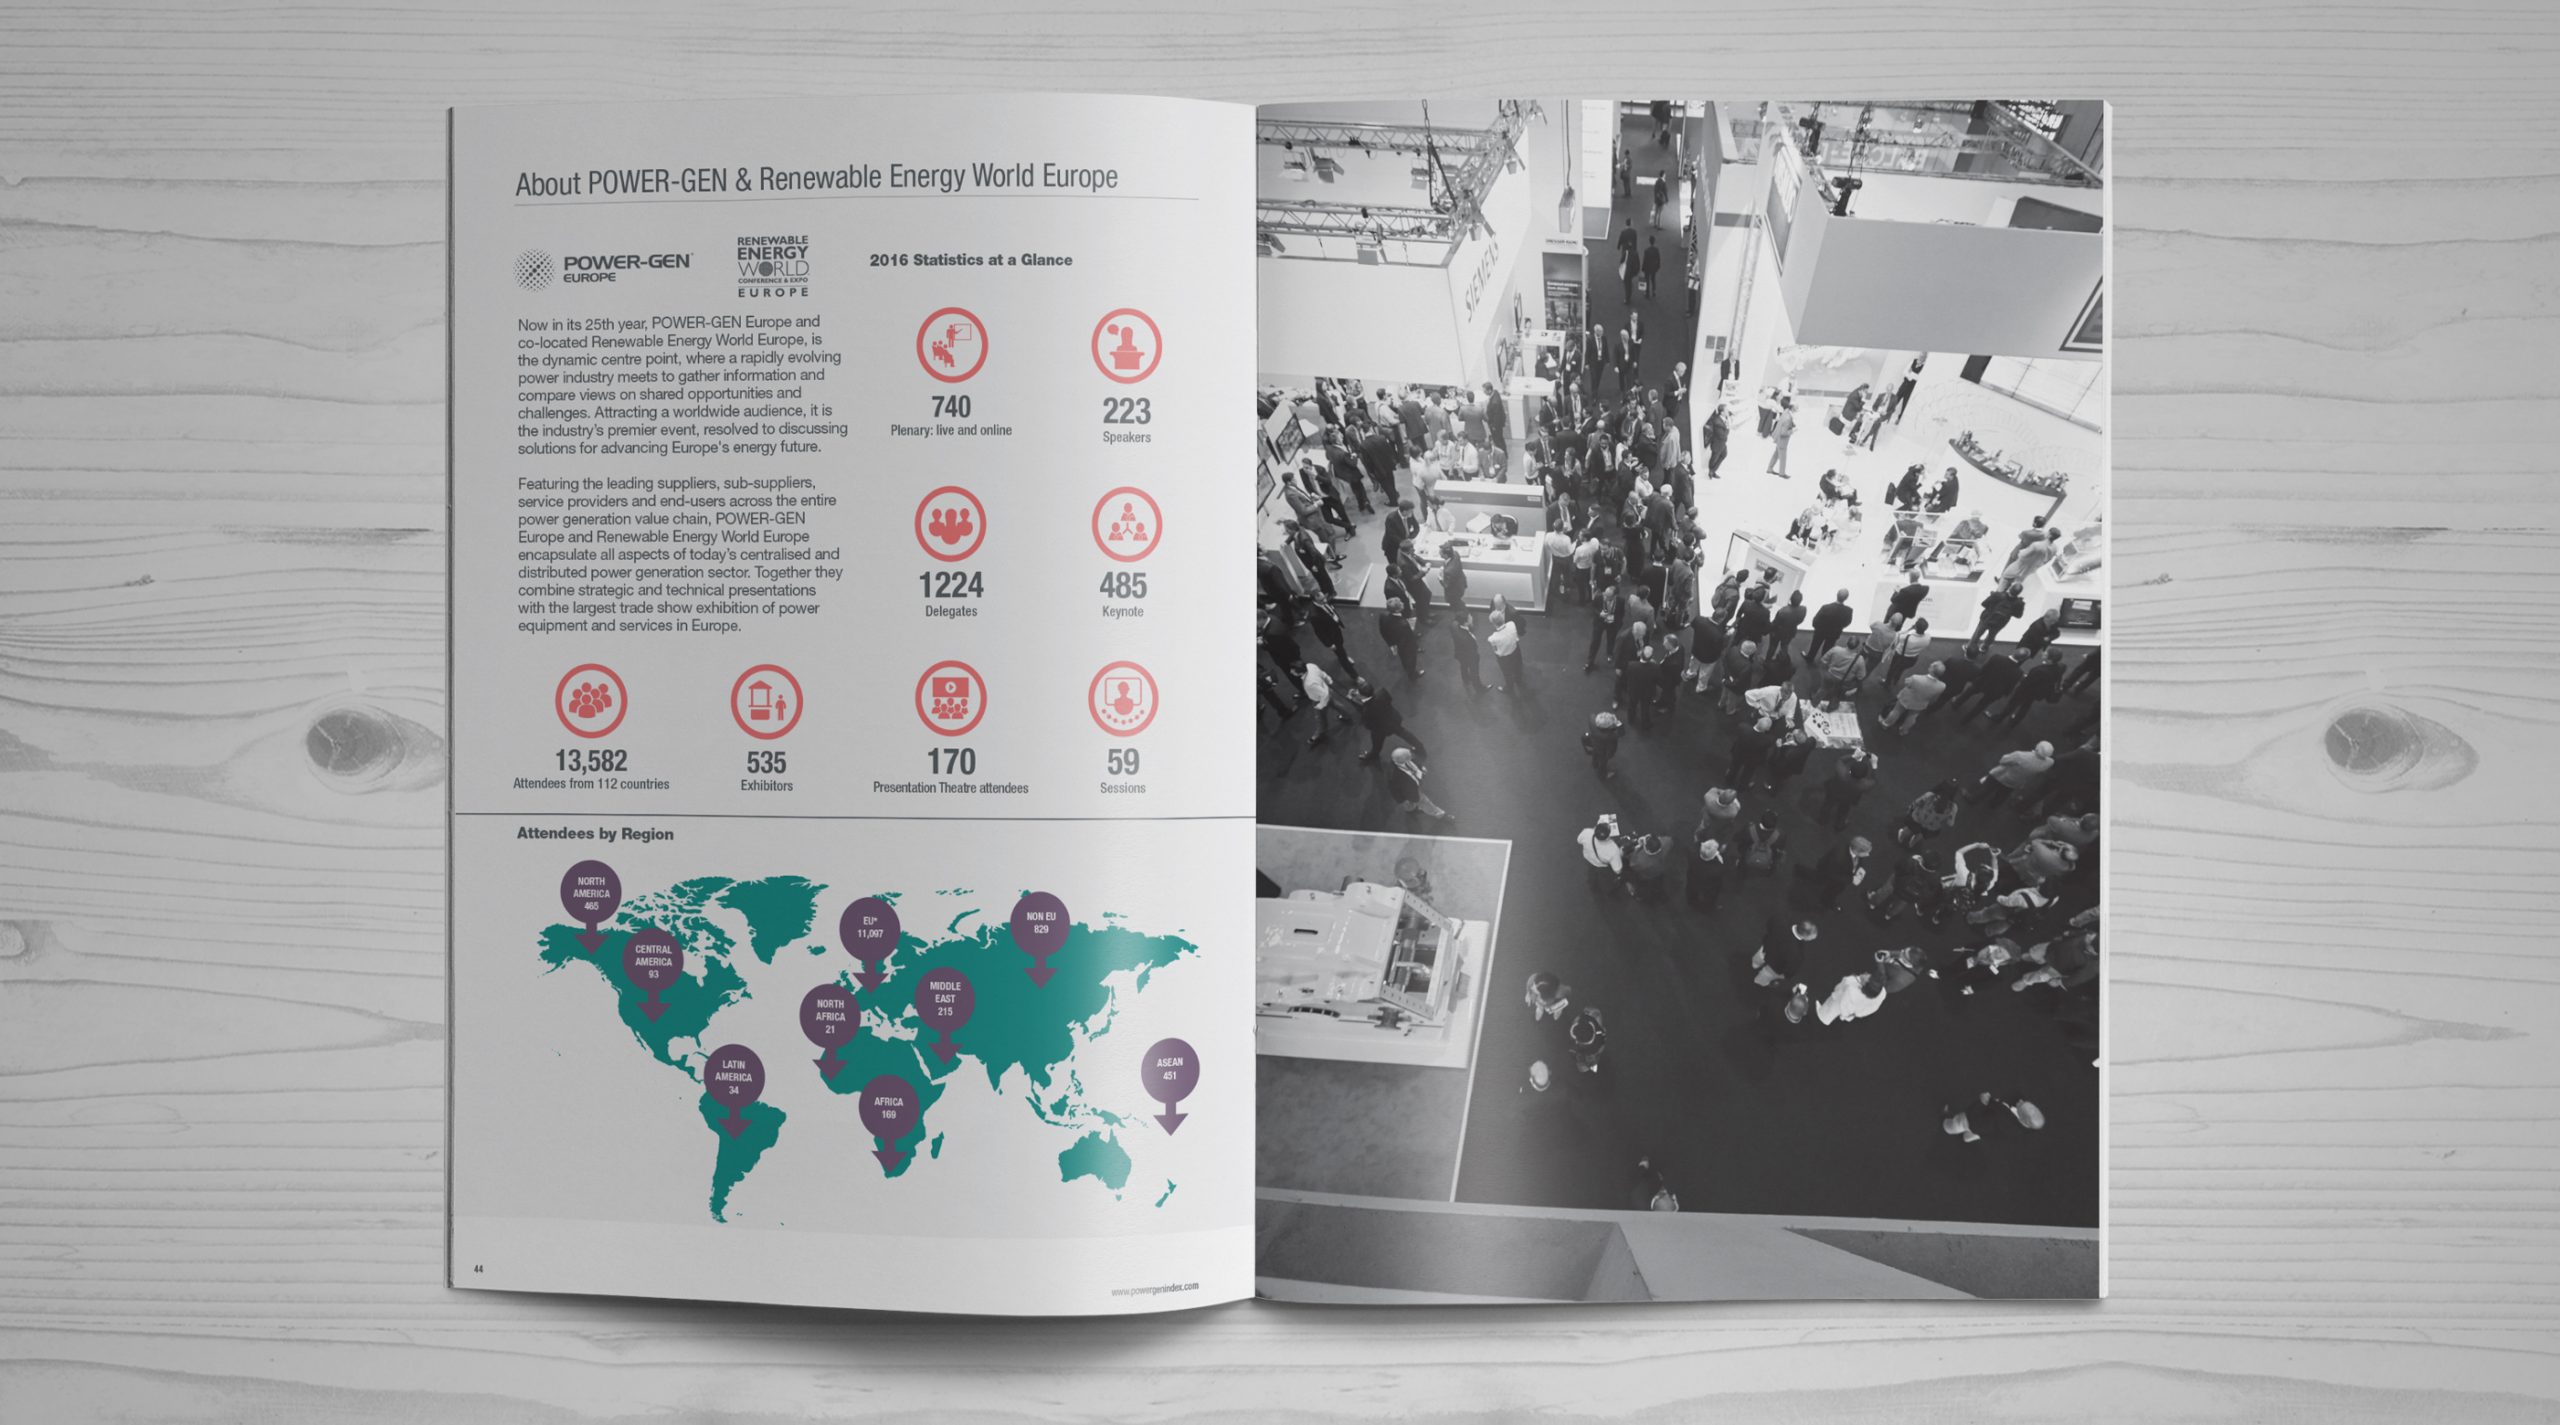
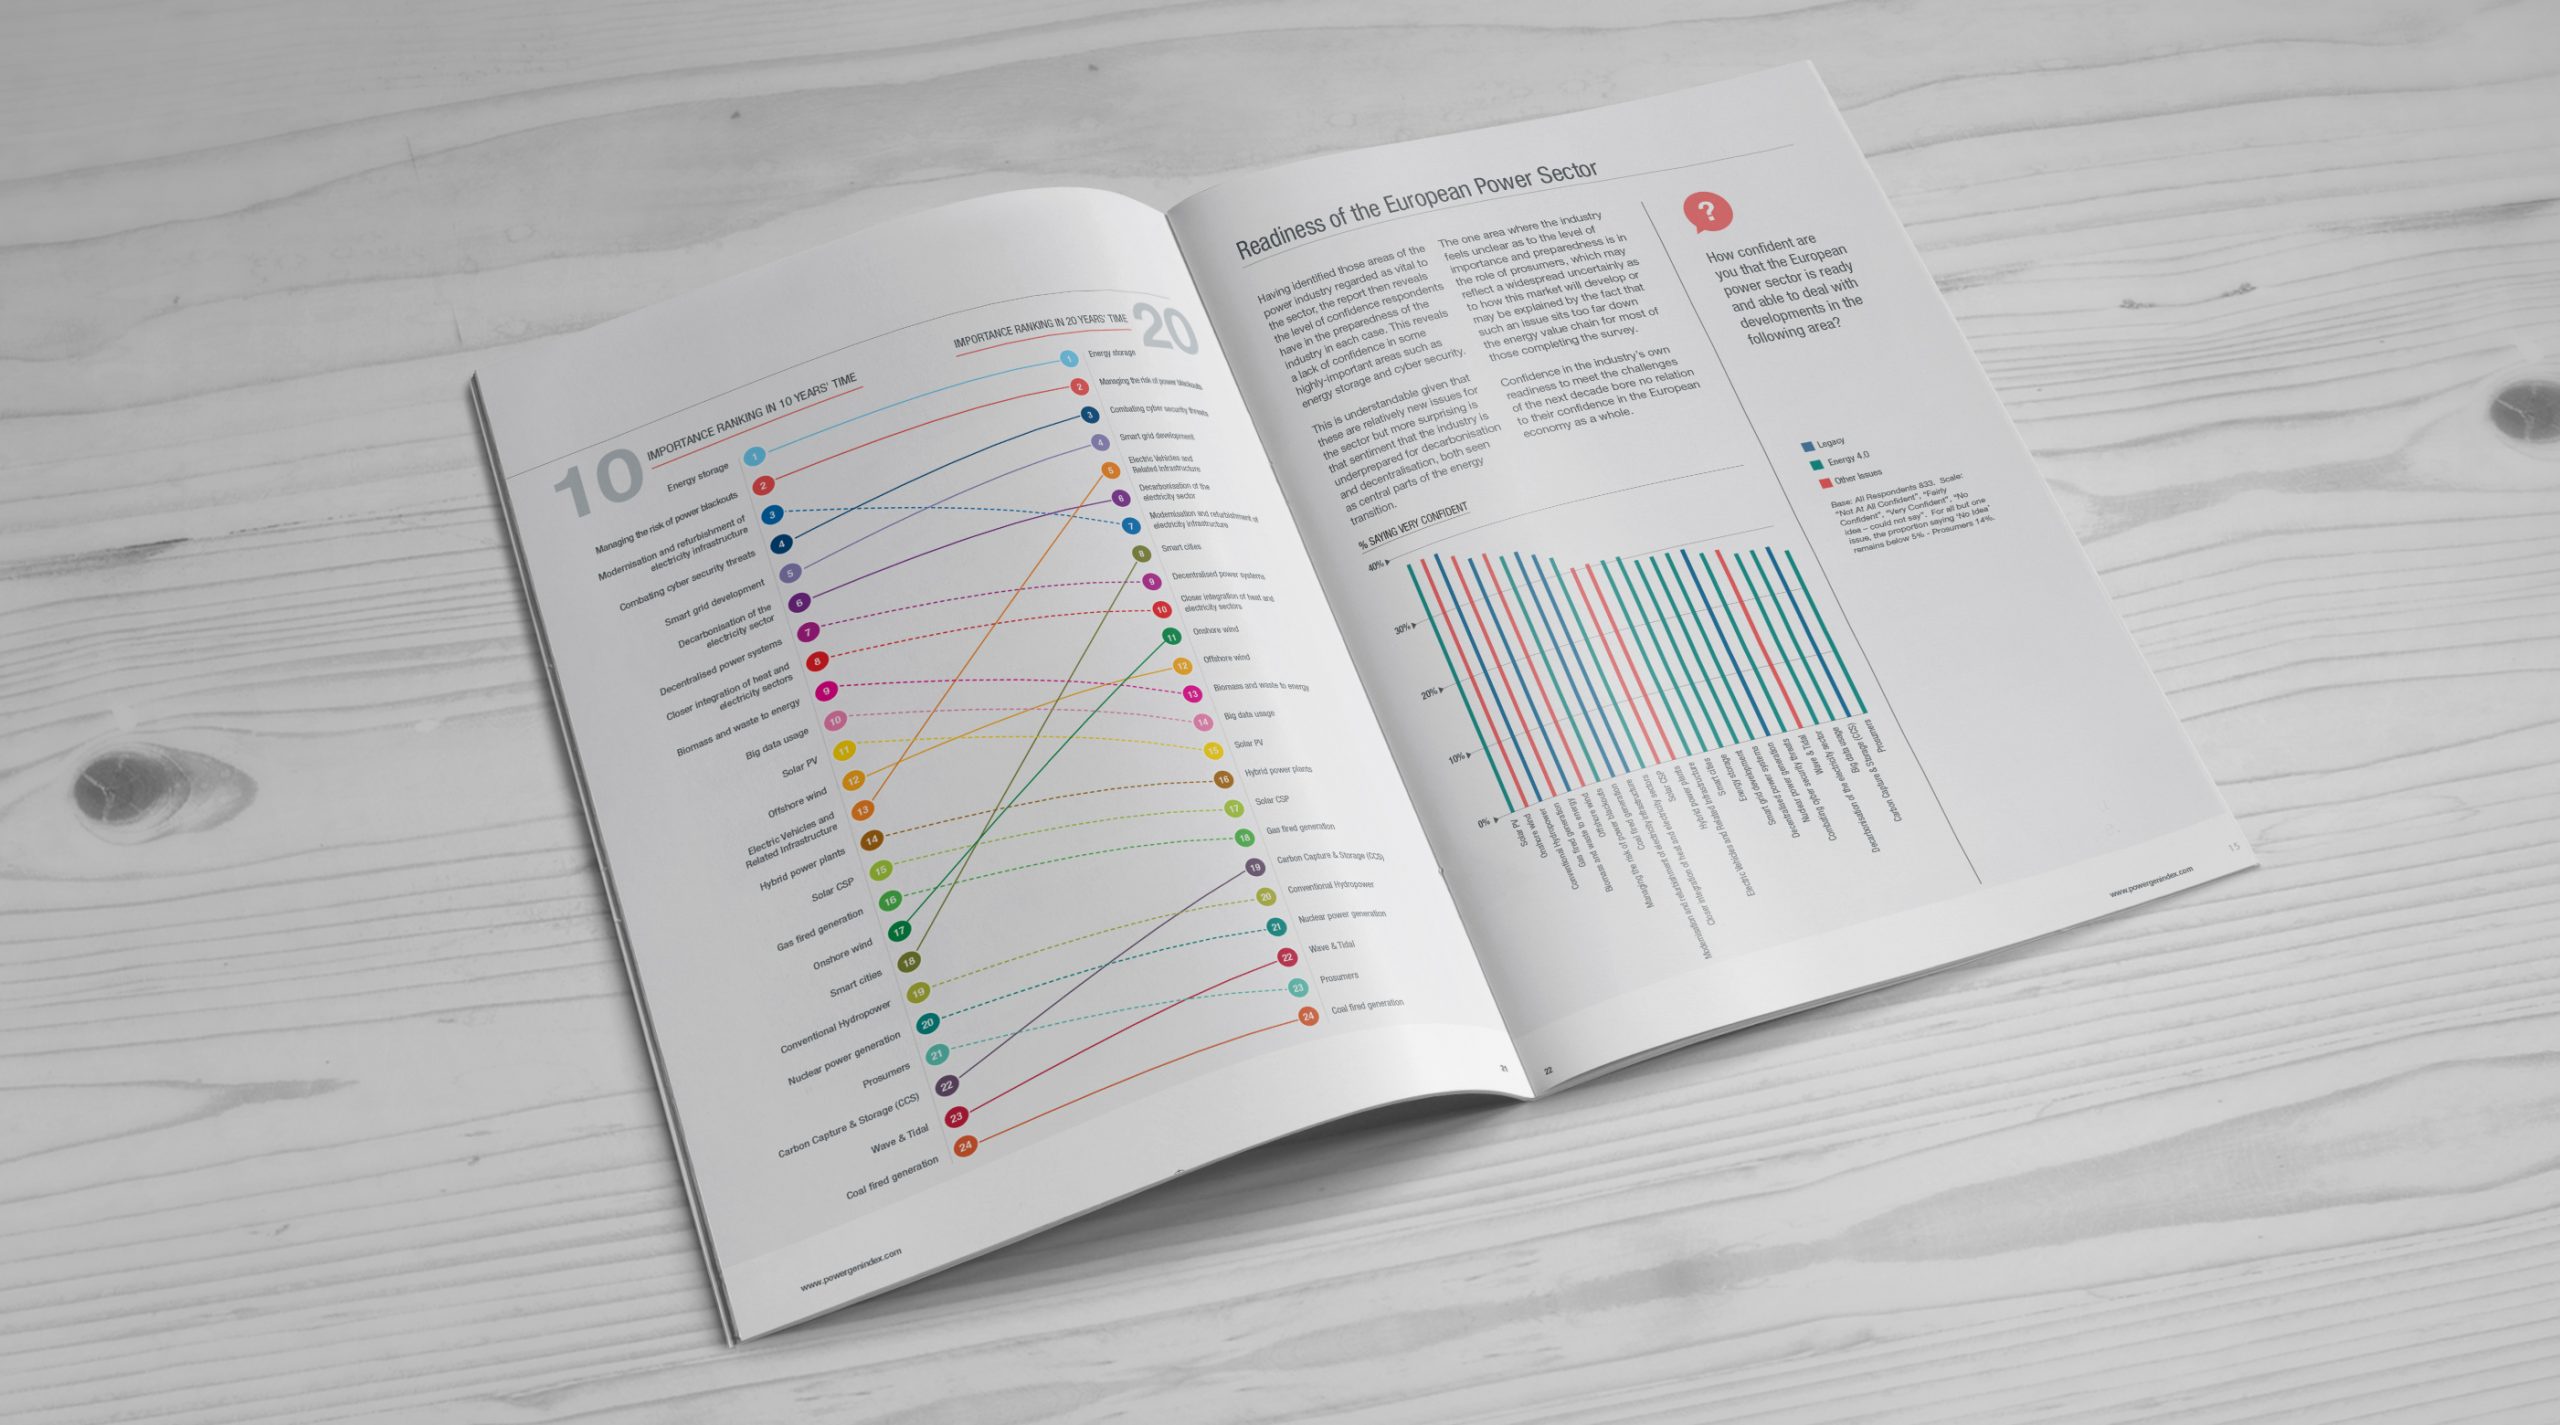
I began by organising the data into bite-sized segments and further structured them into chapters, forming a foundation akin to that of a book. Employing a blend of graphs, infographics, and custom iconography, I reimagined the data into a more digestible format. Crucial data points were adeptly presented through user-friendly graphs and informative infographics.
It was the combination of these various visual elements, particularly the use of iconography, that culminated in a document that surpassed my client’s expectations.
[/vc_column_text][/vc_column][/vc_row][vc_row initial_loading_animation=”fadeIn” pofo_hidden_markup_1507705031_2_44=”” css=”.vc_custom_1507705055609{padding-top: 0px !important;padding-bottom: 0px !important;}”][vc_column width=”1/1″ pofo_hidden_markup_1507709561_2_20=”” css=”.vc_custom_1507709739552{padding-right: 0px !important;padding-left: 0px !important;}”][vc_single_image image=”3460″ img_size=”full” alignment=”center” el_class=”no-margin-bottom single-img-full” css=”.vc_custom_1704293254692{padding-bottom: 50px !important;}”][/vc_column][/vc_row][vc_row initial_loading_animation=”fadeIn” pofo_hidden_markup_1507705031_2_44=”” css=”.vc_custom_1507705055609{padding-top: 0px !important;padding-bottom: 0px !important;}”][vc_column width=”1/1″ pofo_hidden_markup_1507709561_2_20=”” css=”.vc_custom_1507709739552{padding-right: 0px !important;padding-left: 0px !important;}”][vc_single_image image=”3459″ img_size=”full” alignment=”center” el_class=”no-margin-bottom single-img-full” css=”.vc_custom_1704293278623{padding-bottom: 50px !important;}”][/vc_column][/vc_row][vc_row full_width=”container” initial_loading_animation=”fadeIn”][vc_column width=”1/6″][/vc_column][vc_column width=”1/6″][/vc_column][vc_column width=”1/6″][/vc_column][vc_column width=”1/2″][vc_column_text pofo_hidden_markup_1507704568_2_78=”” pofo_hidden_markup_1507704232_2_82=”” css=”.vc_custom_1704293596851{margin-bottom: 30px !important;}”]
This was an exciting opportunity to showcase the benefits of data visualisation and graphic design. By seamlessly translating Excel data into captivating infographics, this project aims to create a brochure that not only informs but also captivates and engages its audience.
[/vc_column_text][/vc_column][/vc_row][vc_row initial_loading_animation=”fadeIn” pofo_hidden_markup_1507705031_2_44=”” css=”.vc_custom_1507705055609{padding-top: 0px !important;padding-bottom: 0px !important;}”][vc_column width=”1/1″ pofo_hidden_markup_1507709561_2_20=”” css=”.vc_custom_1507709739552{padding-right: 0px !important;padding-left: 0px !important;}”][vc_single_image image=”3456″ img_size=”full” alignment=”center” el_class=”no-margin-bottom single-img-full” css=”.vc_custom_1704293335255{padding-bottom: 50px !important;}”][/vc_column][/vc_row][vc_row initial_loading_animation=”fadeIn” pofo_hidden_markup_1507705031_2_44=”” css=”.vc_custom_1704109421157{padding-top: 0px !important;padding-bottom: 0px !important;}” id=”contact”][vc_column width=”1/1″ pofo_hidden_markup_1507709561_2_20=”” css=”.vc_custom_1507709739552{padding-right: 0px !important;padding-left: 0px !important;}”][/vc_column][/vc_row]